Will the EPA Create Winners and Losers?
Yesterday the EPA announced proposed rules to limit the carbon emissions from electrical generation. Under the new rules, each state will have to reduce its carbon emissions from power plants by the year 2030. One of the challenges for national carbon regulations is that some states generate much more carbon per unit of electrical generation than other states. This is due to each state’s generation mix - coal, gas, nuclear, wind, solar, hydro, etc. – and the age of their generation facilities – with newer facilities and recently retrofitted facilities tending to emit less carbon. This presents the EPA with a challenge. Do they present a single carbon emission target for all states and have certain states pay a disproportionate share of the costs of compliance? Or do they give each state a target based on their current carbon emissions and not give the states that have been more aggressive in adoption of nuclear, natural gas, renewables and plant retrofits the benefit of these earlier decisions?
Which States Emit More Carbon?
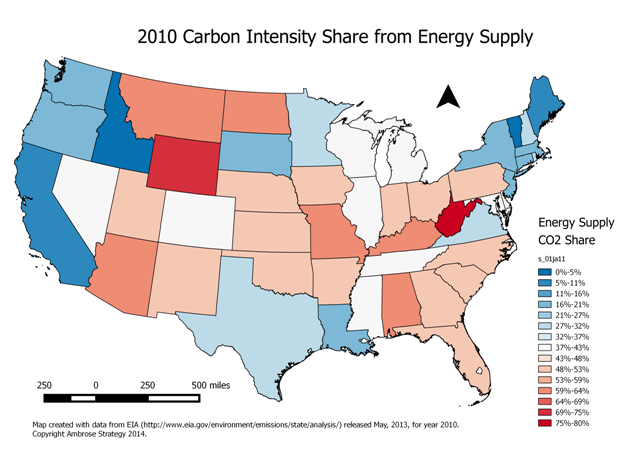
We can use data from the US Energy Information Administration (EIA) to get a sense of which states’ power plants are bigger carbon emitters. Last year the EIA published data on the share of carbon
emissions in each state that came from commercial, electric power generation, residential, industrial and transportation.  Adding the shares up in any state would give you 100% of that state’s carbon emissions. A map of the most recent EIA data (2010) on the share of carbon emissions from power generation shows that states in the northeast and in the west tended to emit relatively less carbon in their electricity generation. Looking at the map, we would also assume that Texas and Louisana are also ahead of the curve when it comes to carbon emissions from power plants, but their numbers are skewed by their large energy (oil and gas) industries.
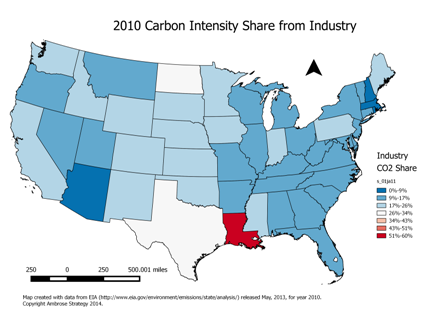
  A similar map that looks at 2010 carbon emmissions from industry shows that the big energy producing states of North Dakota, Texas and Louisiana all have a disproportionately large share of carbon emissions coming from industry. This large industry carbon share skews the percentage of their carbon emissions from power plants artificially low.
An initial look at the EPA proposal shows that it’s adopted individual goals for each state based on the ability to improve energy efficiency, upgrade existing generation and increase the use of low-carbon and zero-carbon generation. EPA has a map here and, if you click on each state, it gives the rationale for that state’s carbon emission goal. The goals appear to generally require smaller percentage reductions from states that currently have more carbon intensive electrical generation. At this early stage, it remains to be seen how the costs of the proposed rules are spread among the states. The states, businesses and economic developers need to be sure that these numbers are transparent and I expect each state will push EPA hard to be sure that the final rules minimize the costs their residents will have to bear .
Comments
Leave a Comment