The Good, the Bad and the Ugly – State Revenue Collections
I’ve been reading a lot lately about the shape of state tax revenue collections. The headlines have run the gamut from “State Tax Collections Reached Record High in 2012” to “GAO Report Paints Bleak Fiscal Outlook for States, Local Governments”. Given the diversity of outlook, it’s tempting to quote Dire Straits and say that “one of them must be wrong”. In this case, there is truth in both headlines, but I’m afraid the bottom line is not very cheery.
The Census Bureau recently reported the new state tax revenue collections data for each state. The Census Bureau data is interesting at both the national and the state-by-state level. In this post, I’ll take a look at the aggregated national numbers and in part 2, I’ll look at the state-by-state numbers.
An initial look at the aggregated state tax revenue collections affirms the good news of the first headline.
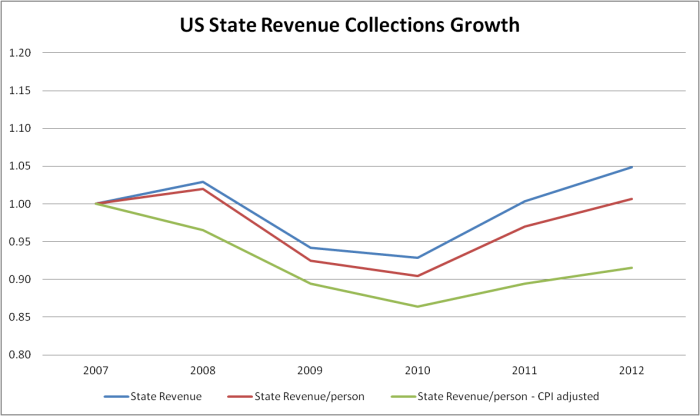
- In 2011, tax collections returned to the 2007 levels for the first time since the beginning of the recession (Table 1 – blue line).
- In 2012, state tax revenues grew again, this time by almost 5%, surpassing their previous all-time high that occurred in 2008.
In the context of the past 5 years, this is clearly welcome news, but a deeper look at the data is far less encouraging.
Revenue Growth Still Lags Population Growth and Inflation
Tax revenue growth gives governments more budgetary options, but the growth we’ve seen up to this point will only go so far. For starters, the census numbers don’t take into account population growth or inflation. So let’s first look at the state tax revenue collections/person. The 2012 tax revenue collections/person still hadn’t returned to prerecession levels, but only made it back to 2007 levels (Table 1 – red line).
The real kicker comes when those numbers are adjusted for inflation. Even with the relatively low inflation we’ve experienced in the past several years, inflation-adjusted state revenue collections/person are only 92% of their 2007 levels (Table 1 – green line). These revenue numbers would be challenging to deal with in any situation. Unfortunately, they come against a backdrop of the recession’s increased demand for many state services, reduced federal support for states, increasing health care costs, mounting unmet infrastructure needs and very large pension liabilities. The states, as a whole, look to be in a very difficult fiscal situation for years to come.
Stay tuned! Part 2 will look at state tax revenue collections at the individual state level.

Comments
going here
prices at the furniture shops by utilizing hardwood household furniture plans and
make some your own self? It is actually feasible
and also a lot of people are actually actually doing it.
As opposed of what many individuals presume, it is not needed to be an expert
to make hardwood furnishings.
Leave a Comment